Monday, March 24, 2014

Chapter 1 Cont...Tracking Growth

In the current system of education, data is used to monitor student growth which is then correlated to teachers' effectiveness.  This controversial use of data has caused tension with in the system it represents. 

Does this make any sense???

In some assessments, such as the Tennessee Value-Added Assessment System (TVAAS), the teacher is assessed by the students growth from one year to the next.  The frustration for many teachers was that is was not assessing the growth of the same student.  It would assess this year's third graders, with next year's third graders, to last year's third-graders.  Logically, one would conclude, that in order to assess growth accurately, one would have to assess the growth of a child from third grade to the fourth grade.


With the current teacher evaluation system, I have heard the following claim which presents no logic,  "...three years of effective teachers has an enormous impact on test scores."  This claim often leads teachers to believe they are in a lose/lose situation.  Secondary teachers often ask, "Why bother?"  Using the data collected from summative assessments as an indicator of a teacher's effectiveness can not be considered as a valid way to assess teachers.


Thursday, March 20, 2014

Chapter 1: Data, Their Uses, and Their Abuses

Often, as we try to seemingly crack the code, data can be frustrating and overwhelming.  One thing to remember, is that it can be spun to represent a situation in either a positive or negative view.  It all depends on how the data is perceived.  As Dr. Bracey reminds us in chapter one, "Statistics, the language of data, are human constructions and must be interpreted by other humans for the numbers that have meaning." (Bracey, 2)

Data vs. Capta

Data: Latin for givens...there are no givens.
Capta: Dr. Bracey made up the term capta, which is derived from the proper Latin equivalent of data, captiva, which means taken.

To distinguish the difference between the two may seem like a small step, but it really speaks to the perception we have when data is referred to.  When we say, given we assume that the information was given for a single purpose.  In reality, information is taken from data and used/manipulated as proof of a theory. Before we are fooled by the use of statistics as pure fact, it is important to question the motive behind the theory being proven.  Then question the validity of the statistics by referring to the 32 principals of Dr. Bracey.

Rate vs. Number

While using statistics, a speaker/writer, can refer to a rate vs. a number to mislead their audiences.  One example is as follows:

"In his column of June 23, 2005, Washington Post pundit George Will wrote, 'Yet George W. Bush has increased the Department [of Education's] budget by 40 percent- more than the defense budget.'" (Bracey, 3)

This use of rate misleads audiences to believe that former President Bush's budget demonstrates higher increase to the Department of Education than to the Department of Defense.  Blind assumptions are dangerous.

Let's look at the numbers:

The Department of Defense made $402,635,000,000 in 2005. 
The Department of Education made $71, 477, 945,000 in 2005

If we have a small increase to an already large number, the large number is still made larger. 

This is just one, out of many examples, where the language used when statistics are thrown around can be misleading.
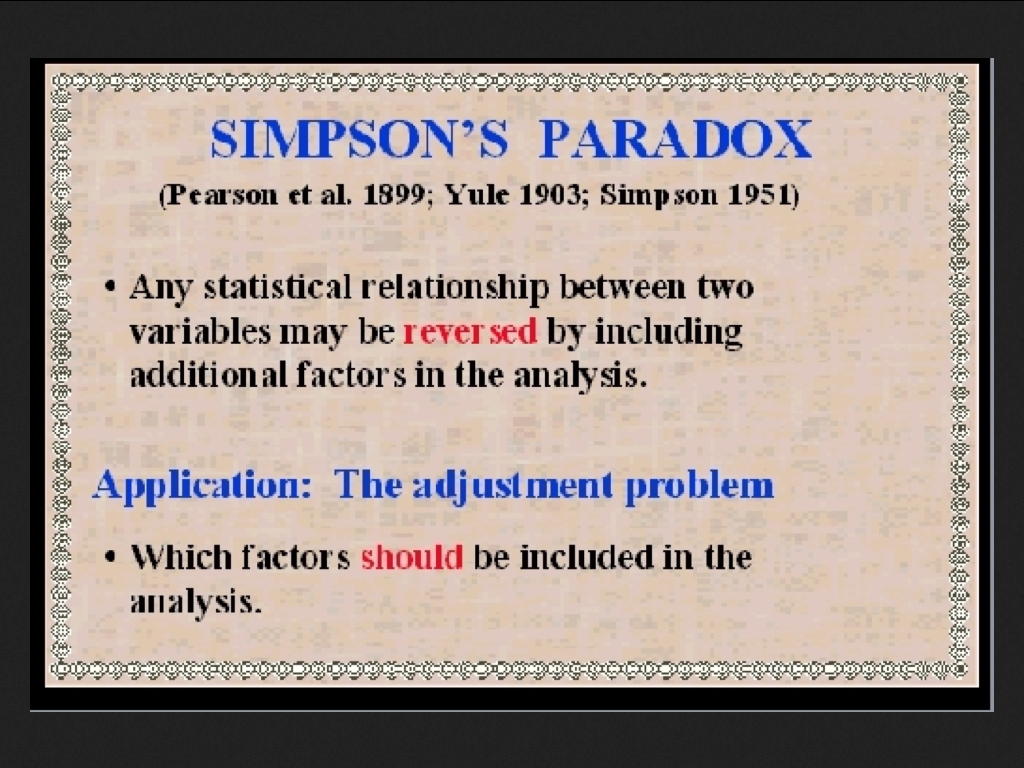


Simpson's Paradox

The 12th principal, according to Dr. Bracey, states: "Watch out for Simpson's Paradox." I further researched Simpson's Paradox:

The Simpson's Paradox was first discovered by Karl Pearson (1899) and Undy Yule (1903), but further elaborated by Edward H. Simpson (1951), and again by Colin R. Blyth (1972).


There are at least three variables related to Simpson's Paradox:
1. the explained
2. the observed explanitory
3. the lurking explanitory

For a more in depth explanations follow these links:
http://vudlab.com/simpsons/
http://en.wikipedia.org/wiki/Simpson%27s_paradox


32 Principals of Data Interpretation

One point that Dr. Bracey makes very certain, is the rule that you should never take statistics at face value.  He lists thirty-two principals that should be considered while interpreting data:

  1. Do the arithmetic.
  2. Show me the data!
  3. Look for and beware of selectivity in the data.
  4. When comparing gourps, make sure the groups are comparable. 
  5. Be sure the rhetoric and the numbers match.
  6. Beware of convenient claims that, whatever the calamity, public schools are to blame.
  7. Beware of simple explanations for complex phenomena.
  8. Make certain you know what statistic is being used when someone is talking about the "average."
  9. Be aware of whether you are dealing with rates or numbers.  Similarly, be aweare of whether you are dealing with rates or scores.
  10. When coparing either rates or scores over time, make sure the groups remain comparable as the years go by.  
  11. Be aware of whether you are dealing with  ranks or scores.
  12. Watch out for Simpson's paradox.
  13. Do not confuse statistical significance and practical significance.
  14. Make no causal inferences from correlation coefficients.
  15. Any two variables can be correlated.  The resultant correlation coefficient might or might not be meaningful.
  16. Learn to "see through" graphs to determine what information they actually contain.
  17. Make certain that any test aligned with a standard comprehensively tests the material called for by the standard.  
  18. On a norm-referenced test, nationally, 50 percent of students are below average, by definition. 
  19. A norm-referenced standardized achievement test must test nly material that all children have had an opportunity to learn. 
  20. Standardized norm-referenced testes will ignore and obscure anything that is unique about a school.  
  21. Scores from standardized tests are meaningful only to the extent that we know that all children have had a chance to learn the material which the test tests. 
  22. Any attempt to set a passing score or a cut score on a test will be arbitrary.  Ensure that it is arbitrary in the sense of arbitration, not in the sense of being capricious. 
  23. If a situation really is as alleged, ask, "so what?"
  24. Achievement and ability tests differ mostly in what we know about how students learned the tested sills. 
  25. Rising test scores do not necessarily mean rising achievement.
  26. The law of WYTIWYG applies: What you test is what you get.
  27. Any tests offered by a publisher should present adequate evidence of both reliability and validity.
  28. Make certain that descriptions of data do not include improper statements about the type of scale being used, for example, "the gain in math is twice as large as the the gain in reading."
  29. Do not use a test for a purpose other than the the one it was designed for without taking care to ensure it is appropriate for the other purpose. 
  30. Do not make important decisions about individuals or groups on basis of a single test.
  31. In analyzing test results, make certain that no students were improperly excluded from the testing. 
  32. In evaluating a testing program, look for negative or positive outcomes that are not part of the program.  For example, are subjects not tested being neglected? Are scores on other tests showing gains or losses?

Wednesday, March 19, 2014

About the Author: Gerald W. Bracey

In our data driven world, unless you are someone with a degree in analyzing statistics, it is difficult to keep up with the amount of statistics that serve countless motives.  With Ph.D. from Stanford University in developmental psychology, and experience working in various positions Dr. Gerald W. Bracey's book Reading Educational Research: How to Avoid Getting Statistically Snookered, offers guidance on our journey through our ever-so-quoted statistical world.

For more information on Dr. Gerald W. Bracey, follow the links below. 


 http://www.huffingtonpost.com/gerald-bracey

http://nepc.colorado.edu/author/bracey-gerald-w